Explaining the Global Economic Recovery in 6 Charts
As U.S. stock markets continue to touch all-time highs, we illustrate the magnitude and speed of the economic recovery since the onset of the pandemic and subsequent recession.
COVID-19 vs. Historical Infectious Disease Outbreaks
Tremendous uncertainty surrounded the potential impact of the coronavirus on the global economy last year. Forecasting an outbreak’s impacts and disentangling the pandemic-specific effects from the numerous other factors that can impact the global economy is extremely hard.
We can examine stock market returns going back more than a century to the 1918 Spanish flu pandemic as evidence of this fact. Now, some 20 months into the COVID-19 pandemic, we can compare how markets have reacted during this outbreak with others throughout history.
In Figure 1, we plot the growth of $1 for the S&P 500® Composite Index in the months following the first reported cases of several outbreaks. With the exception of COVID-19, which is ongoing, the end of the line for each outbreak shows the ending value when the outbreak subsided. It is worth noting that, even after the fact, there is much uncertainty in determining the precise duration of each outbreak.
Two things stand out in Figure 1. First, the stock market drawdown was faster and more severe for COVID-19 than any other outbreak. Second, the strength (and speed) of the recovery following the drawdown was also remarkable. In fact, it took just 173 days for the S&P 500® Index to get back to its February 19, 2020, level.
Overall, the S&P 500 Index finished up 18.40% for 2020 and has climbed even higher in 2021, returning 21.58% year-to-date through August.
While there are ongoing concerns about vaccine availability in developing economies and vaccination rates in developed economies, alongside new COVID-19 mutations such as the delta variant, so far this recovery has not been isolated among U.S. stocks.
Figure 1 | Growth of $1 During Infectious Disease Outbreaks

Sources: Avantis Investors, Robert Shiller Data Collection at Yale University, and Centers for Disease Control and Prevention. Past performance is no guarantee of future results. The S&P 500 Composite Index is a market-capitalization-weighted index of the 500 largest U.S. publicly traded companies. The index is widely regarded as the best gauge of large-cap U.S. equities. The Composite Index does not include reinvested dividends.
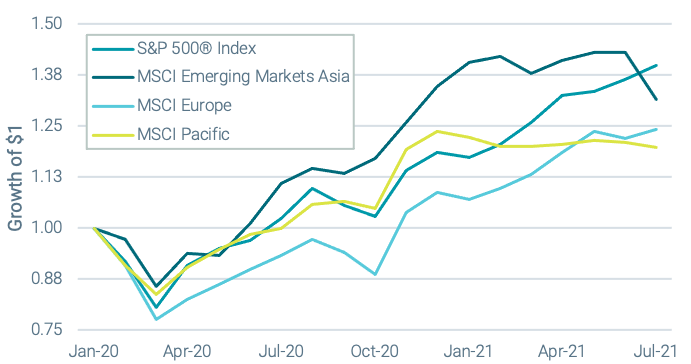
Figure 2 plots returns for European developed markets, Pacific developed markets and Asian emerging markets alongside the U.S. stock market. Asian emerging markets, including China, initially recovered more quickly, although U.S. stocks have since caught up. International developed markets have also more than made up the ground lost early in 2020.
Figure 2 | A Global Recovery; Growth of $1 During COVID-19 Pandemic

Data from 1/1/2020 – 7/31/2021. Source: Avantis Investors, data from Bloomberg. Past performance is no guarantee of future results. Investing involves risk including the possible loss of capital. It is not possible to invest directly in an index. The MSCI Emerging Markets Asia Index captures large and mid cap representation across 9 Emerging Markets countries. The MSCI Europe Index captures large and mid cap representation across 15 Developed Markets (DM) countries in Europe. The MSCI Pacific Index captures large and mid cap representation across 5 DM countries in the Pacific region.
In Figure 3, the dotted line plots the U.S. unemployment rate on the right axis. Last spring, the top-level unemployment rate spiked by more than 11% between February and April, topping out at just under 15%. This chart also includes the different durations of unemployment over the same period on the left axis.
The peaks of each solid line tell the story about how long folks had to endure unemployment. While large percentages had to go up to 14 weeks without work, it appears many were able to reenter the workforce within that time frame. The unemployment spike, while incredibly pronounced, was reasonably short-lived, especially if you compare it to previous numbers, such as those after the 2008-2009 global financial crisis.
Figure 3 | Back to Work–Most Unemployment Was Short-Lived

Data from 1/1/2020 – 7/31/2021. Source: Bureau of Labor and Statistics. Duration of unemployment numbers are seasonally adjusted.
While employment numbers can provide insight into available labor capacity to produce goods, many additional factors contribute to gross domestic product (GDP) output, the predominant measure of the overall health of an economy. The Organization for Economic Co-operation and Development (OECD) includes 38 member countries from regions all across the world and publishes forecasts of future expected GDP.
In Figure 4, we include OECD forecasts for Real GDP for the U.S., China and various groups of developed and emerging economies. Real GDP assumes constant prices, so the lines display relative volume of output versus a base case (here, Q4 2019 is the base case). Any numbers lower than 100 signal a contracted output, while any numbers higher than 100 indicate growth.
China, the top line in the chart, recovered almost immediately, surpassing the Q4 2019 output by Q2 2020. The World GDP output is estimated to have returned to pre-pandemic levels as of Q2 2021. Europe’s recovery has been slower, but the most recent quarter was better for some countries.
For example, Real GDP growth was 4.8% for the UK in Q2-2021 and 2% for the EURO countries, both higher than the U.S., which started its recovery earlier. Still, the expectation is that Europe will not reach prepandemic output levels until the end of 2021. Obviously, as forecasts there are many future unknowns that could impact this picture. However, on balance, it demonstrates how swiftly many economies were able to get on the path to recovery.
Figure 4 | Forecasts Point to Different Paces of Expected Recoveries

Source: OECD (2021), Real GDP forecast (indicator). Accessed August 25, 2021. Gross domestic product (GDP) is a measure of the total economic output in goods and services for an economy. Real GDP is GDP given in constant prices and refers to the volume level of GDP. Constant price estimates of GDP are obtained by expressing values of all goods and services produced in a given year, expressed in terms of a base period. Forecast is based on an assessment of the economic climate in individual countries and the world economy, using a combination of model-based analyses and expert judgment. This indicator is measured in growth rates compared with previous year. Forecasts are not a reliable indicator of future performance.
Record Sales?
While GDP is designed to be more comprehensive, a more direct and tangible way to look at how markets and different sectors are faring is to look at sales, operating profits or earnings of companies, and growth levels over time. Many recent articles have pointed to record 12-month changes in sales and earnings levels.
Figure 5 plots sales growth for various market indices and sectors comparing Q2 2021 versus Q2 2020, and some numbers are shocking at first glance. Overall, S&P 500 companies sales increased 26% year-over-year, while increases in some sectors such as Consumer Discretionary and Energy were even higher.
While this speaks to how much demand has come back for many goods and services, we believe it is useful to look at a slightly more comprehensive picture. Q2 2020 was generally poor for most sectors, so the growth numbers are biased upward given the low base from 12 months ago.
Figure 5 | Q2 2021 Reported Sales Are Up Significantly from One Year Ago

Source: Bloomberg, FactSet and Avantis Investors. Data as of 6/30/2021. Past performance is no guarantee of future results. Investing involves risk including the possible loss of capital. It is not possible to invest directly in an index. The S&P 500® Energy, Consumer Discretionary, Industrials, Information Technology, Health Care, Utilities, Real Estate, Consumer Stables and Financials are indices that include companies in the S&P 500 that are classified as members of that sector by the Global Industry Classification Standard (GICS).
In Figure 6, we plot quarterly sales numbers for the same indices and sectors as Figure 5 but use Q4 2019 as the base as opposed to Q2 2020.
We can interpret this chart similarly to the Real GDP forecast in that values below 1 signal negative growth in sales, while values above 1 signal positive growth relative to Q4 2019 reported numbers. U.S., nonU.S. developedand emerging markets saw contracted sales in Q1, Q2 and Q3 2020. The U.S. has been back above pre-pandemic levels since Q4 2020, while non-U.S. developed and emerging markets are still just shy of Q4 2019 numbers.
From a sector perspective, consumer staples and health care held up better than others early in the pandemic, while energy fared much worse, but almost all sectors are now just shy or back above previous sales levels.
Figure 6 | Sales Have Generally Returned to Pre-Pandemic Levels Across Markets and Sectors

Asset Allocation and Diversification Still Rule the Day
While much uncertainty remains about COVID-19 and its long-term impacts, we think it is fair to say uncertainty levels are not higher today than in March or April 2020. It is also unlikely that forecasts then would have predicted the pace and magnitude of this recovery, even with the remarkable levels of stimulus injected into the system.
We believe a sound strategy for investors in both calm and anxious times is holding well-diversified portfolios of stocks and bonds, with a proportion of risky and risk-hedging assets they think they can stick with over the long-term.
Glossary
MSCI Emerging Markets Index. Captures large- and mid-cap representation across 27 emerging markets countries. With 1,202 constituents, the index covers approximately 85% of the free float-adjusted market capitalization in each country.
MSCI World ex USA Index. Captures large- and mid-cap representation across 22 of 23 developed markets countries.
S&P 500® Index. A market-capitalization-weighted index of the 500 largest U.S. publicly traded companies. The index is widely regarded as the best gauge of large-cap U.S. equities.
This material has been prepared for educational purposes only. It is not intended to provide, and should not be relied upon for, investment, accounting, legal or tax advice.
Investment return and principal value of security investments will fluctuate. The value at the time of redemption may be more or less than the original cost. Past performance is no guarantee of future results.
Diversification does not assure a profit nor does it protect against loss of principal.