When Value Underperforms
Imagine you are a competitive diver in the Olympics. You will be judged on your form, your technique and the difficulty of your dives. The more complicated a dive, the higher your potential score. But also, the higher the chances of not executing the dive perfectly.
Investing is similar. The more risk you take on in your portfolio, the greater your expected return potential. Academic research has shown that different stocks have different expected returns. For example, small company and value company stocks have greater expected returns — and risks — than growth and large company stocks. As an investor, you need to decide how much of these risks you are willing to take.
Value stocks are usually associated with corporations that have experienced slower earnings growth or sales, or have recently experienced business difficulties, causing their stock prices to fall.
Still, value stocks will experience periods of relative underperformance. In the U.S. stock market over the last decade, value stocks have performed poorly relative to growth stocks. Using Dartmouth College Professor Ken French’s data, value appears to have experienced its sixth-worst drawdown ever over the period of January 2007–September 2018, with a cumulative underperformance versus growth stocks of –32.2 percent. This observation contrasts with the long-term data showing that value stocks have outperformed growth stocks by 4.8 percent per year over the period of 1927–2017. For investors who have experienced poor performance in recent years, it is natural to wonder how value stocks tend to perform after periods of poor performance.
Table 1 reports the 2007–2018 drawdown, as well as the five others that were worse.
TABLE 1: VALUE PREMIUM DRAWDOWNS (7/1926–11/2018)**
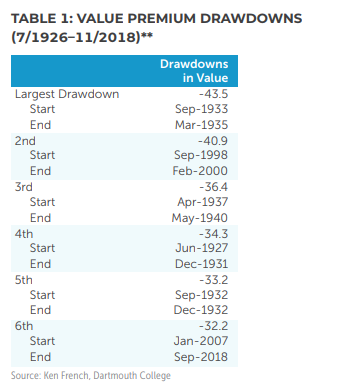
Looking at the five largest drawdowns — which are all from distinct, non-overlapping time periods — they all exceeded –30 percent with the largest being –43.5 percent over the period of September 1933 through March 1935. The –30 percent threshold means that in each of the five drawdowns, value stocks underperformed growth by at least –30 percent over some period of time, with the shortest encompassing less than a year(!) and the longest covering more than four years.
In three of the periods, value essentially went straight down while in two there was a significant recovery that was then followed by a reversal into an extension of the drawdown. Some of the drawdowns occurred over relatively long periods of time while others did not.
Performance After Value Disappoints
Historically, value has done very well after periods of poor performance relative to growth. Table 2 presents the same drawdown statistic for each of the five largest drawdowns cataloged in Table 1, but also presents the total returns to the value premium for the five-and 10-year periods after each drawdown period concluded.
TABLE 2: TOTAL RETURNS AFTER VALUE DRAWDOWNS (7/1926–11/2018)**
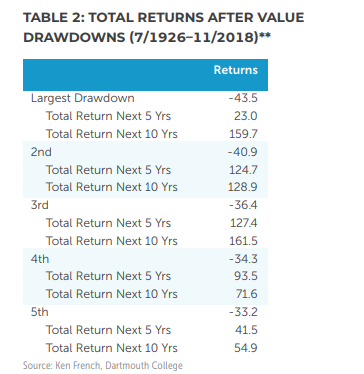
If we take averages across all five of the five- and 10- year horizons, total returns have averaged +82 percent for the five-year horizon and +115 percent for the 10-year horizon. In annualized returns, these are 12.7 and 8.0 percent per year, respectively. The bigger point here is not that we should expect an exact repeat of these averages, but rather understand that the data clearly shows that value has historically done well after extended periods of poor performance.
The 2007–2018 Value Drought
As Table 1 shows, value struggled mightily from 2007 to 2018. In the U.S. market, value underperformed growth by 32.2 percent over the stretch of January 2007–September 2018. One interesting aspect of this period relative to the five that were worse is how long the most recent stretch covered: almost 12 years total. So how might value perform from here? It’s impossible to know for sure, but the results from Table 2 indicate it’s very reasonable to expect value to do well following the difficult period of 2007–2018. This long-term potential for strong performance is why we believe most investors should have an allocation to value in their portfolios.