The 4 Charts Every Investor Should Know
Sometimes a picture really can make things easier to understand. Many of the important ideas and concepts you need to know as a long-term investor don’t require lengthy explanations. They can be as simple as the four charts in this newsletter. Together, these charts illustrate foundational principles of investing such as focusing on the long term, diversification, and not letting emotions compromise your portfolio.
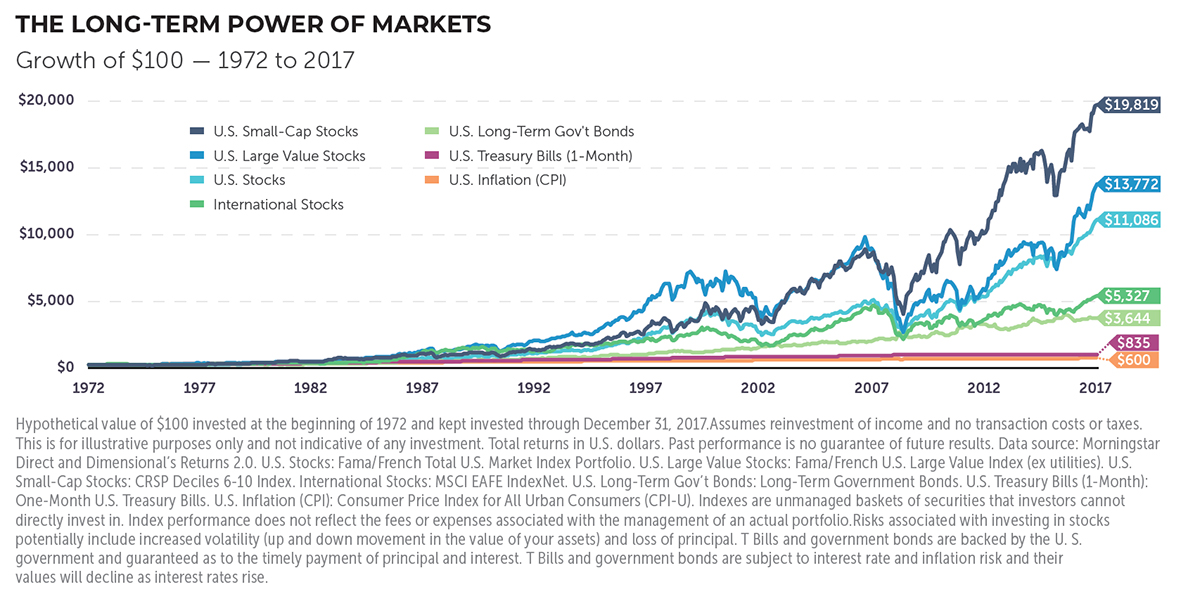
Let Markets Work for You
What This Chart Means to You: Good things may come to those who wait — and to those who don’t let short-term news events scare them out of staying invested. Every generation of investors has had its reasons to worry and pull out of the market: from the Great Depression, World War II, and Vietnam of earlier generations to the more recent Black Monday, dot com bubble, and Great Recession. But if you had invested $100 in the U.S. stock market back in 1972, and left it alone all those years, by the end of 2017 that $100 would have grown to $11,086. Decade after decade, markets around the world have been significant generators of long-term wealth for patient, diversified investors. And depending on your appetite for risk, patience may be rewarded by owning riskier investments like small companies over large, and value companies over growth companies. Academic research finds that small and value companies have outperformed over the long term. As the chart illustrates, that same $100 invested in 1972 in small company stocks would have returned $19,819 at the end of 2017, and invested in large value stocks would have returned $13,772. You can’t get return without risk — that is the price of admission for being an investor. Your Advisor can help you determine how much risk is comfortable for you.
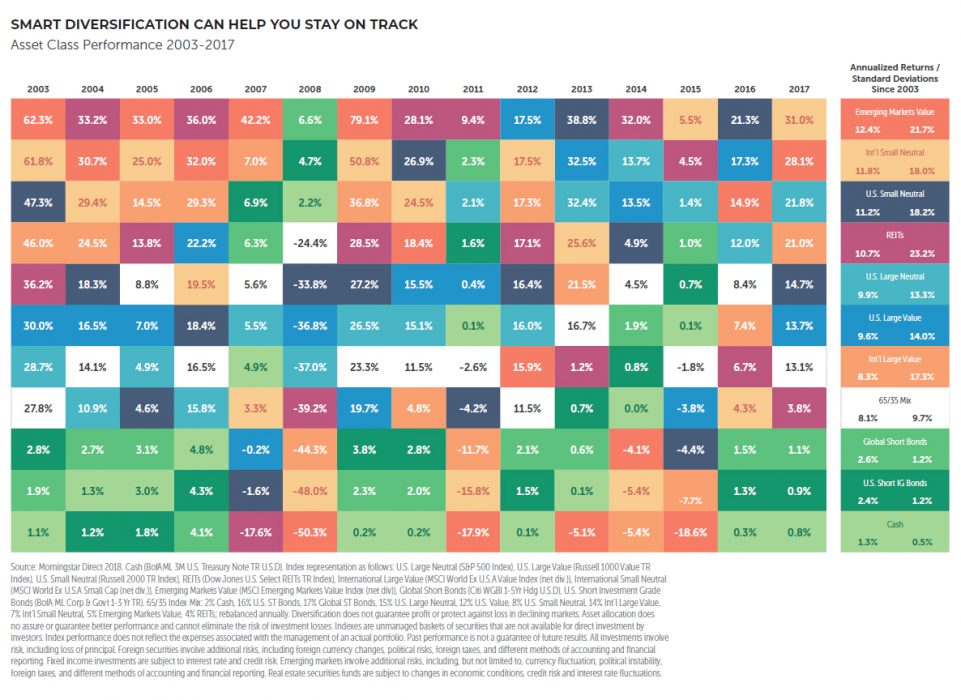
Stay on Track with Diversification
What This Chart Means to You: Investing is not unlike a healthy diet. You don’t eat the same thing every day for breakfast, lunch, and dinner (unless you’re a toddler), so make sure you have variety—in this case, a number of asset classes, such as International, REITs, Short-Term Bonds, etc. As you can see, even though an asset class is on the top one year (like Emerging Markets Value in 2007) that same asset class may be at the bottom the next year (Emerging Markets in 2008). Rather than trying to predict the winners and losers, keep a balanced, globally-diversified portfolio (like the one shown in white) to help you stay on track toward your goals. You won’t be the single best performer in any period, but you will also have fewer reasons to worry about poor returns from a single asset class. And that can help your portfolio get you where you want to go.
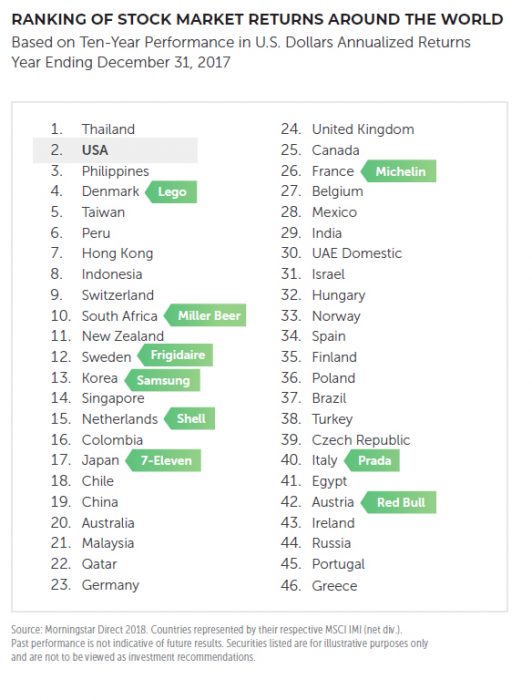
Own Great Companies Around the World
What This Chart Means to You: America may be #1 in our hearts, but there are many other countries with great companies to invest in. The average U.S. investor has a portfolio made up of about 75% U.S. stocks1, which seems patriotic, but can mean missing out on a world of opportunity. You might be surprised by the number of familiar companies and household brands that are internationally owned, such as Lego, Miller Beer, Samsung, and even 7-Eleven. No one can predict which country will be the top performer, (and the U.S. has never been the top performer over any 10-year span of time), but if you own a lot of companies around the world you can worry less if any one company or even one country experiences losses.
1Morningstar, MSCI, as of 3/31/17. “Looking for Value Opportunities Outside the U.S.,” Oppenheimer Funds.com, David Mazza, July 11, 2017
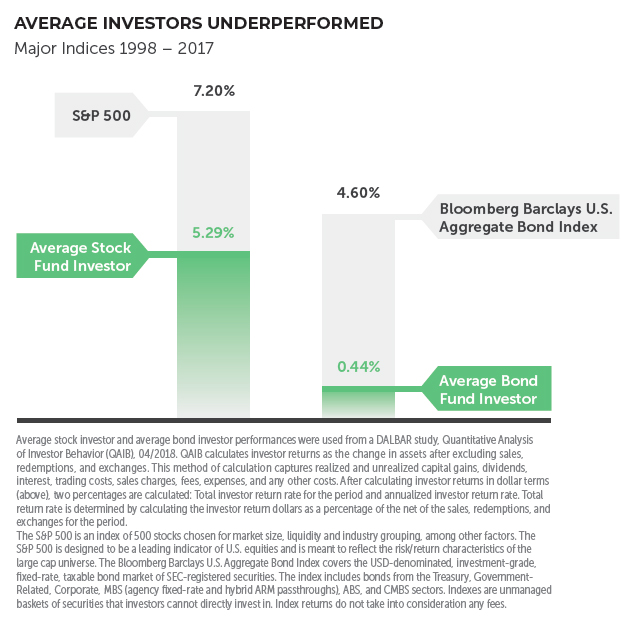
Stop Changing Lanes
What This Chart Means to You: Don’t try to time getting in and out of the market. It’s like trying to go faster on a crowded freeway by constantly changing lanes, only to discover you are going slower than if you had just stayed in the lane you were in. Over the past 20 years, the S&P 500 returned an annual average of 7.20% but average U.S. stock investors earned just 5.29%, primarily because they tried to outsmart the market but kept getting in and out at the wrong times. Many investors think they know when to buy and sell. But this means they have to be right twice: picking the right time to buy and the right time to sell. Other investors might make emotional decisions, like pulling out of the market when stocks are losing. This is where the experience and guidance of your financial advisor can make all the difference and help you stay “in your lane” and headed towards your goals.